
US Population Cause of Death Mortality Improvement Update 2000–2021
By Becca Reppert and Carolyn Covington
Small Talk, December 2023

Introduction
Studying population mortality and its trends by cause of death over time is highly beneficial for understanding mortality improvement of an insured population. Each year, the Centers for Disease Control and Prevention (CDC) releases updated data on US population deaths which can be used to analyze US mortality improvement trends and the causes of death which contributed most to these changes, including COVID-19.
At the beginning of a new decade, the US Census Bureau conducts the census, which is the basis for new population estimates and projections. These estimates are used as the exposure in mortality rate calculations (deaths divided by exposure). Population estimates released in 2021 (referred to as Vintage 2021) incorporated the 2020 census results for the first time, whereas Vintage 2020 used estimates from the 2010 census. Vintage 2020 total population estimates are lower than Vintage 2021. Furthermore, the Vintage 2020 estimates at the oldest ages are higher.
Due to these differences, this analysis uses Vintage 2021 population estimates for both 2020 and 2021, which reflects the update in the census results in 2020 instead of 2021. This update to the 2020 population estimate has not been made by the CDC, including in the CDC Wonder database which many in the industry use as a data source for their own population analysis. As such, the analysis in this article will not match industry views based on CDC Wonder for the year 2020. However, any analysis of pre-pandemic mortality compared to current mortality (as of 2021) will be consistent with these publications.
Reflecting Vintage 2021 in 2020 allows for analysis on a more consistent population basis during both pandemic years by eliminating noise from updating the new census Vintage between 2020 and 2021. This provides a better comparison of mortality rate changes in these years.
Mortality Improvement Trends
US population mortality varies significantly by socioeconomic status. Mortality rates tend to decrease, and life expectancies rise, with income, education, and other measures of socioeconomic status. Better-educated, higher income people live longer, on average, than less-educated, lower income individuals. People at the higher socioeconomic levels are also more likely to seek out individual life insurance than those with less disposable income. This analysis uses educational attainment as a proxy for socioeconomic status since income is not available at a detailed level. Focusing on the more highly educated portion of the US population can provide insights into impacts that may be observed in the insured population.
Figure 1 below displays the age adjusted mortality rates[1] from 2000 to 2021 by educational attainment. The age adjusted rate is only used in this exhibit because all ages are combined in the mortality rate comparisons. All other exhibits use the mortality rate without adjusting for age changes by year.
Figure 1
Age Adjusted US Population Mortality Rates for Ages 15+ by Educational Attainment
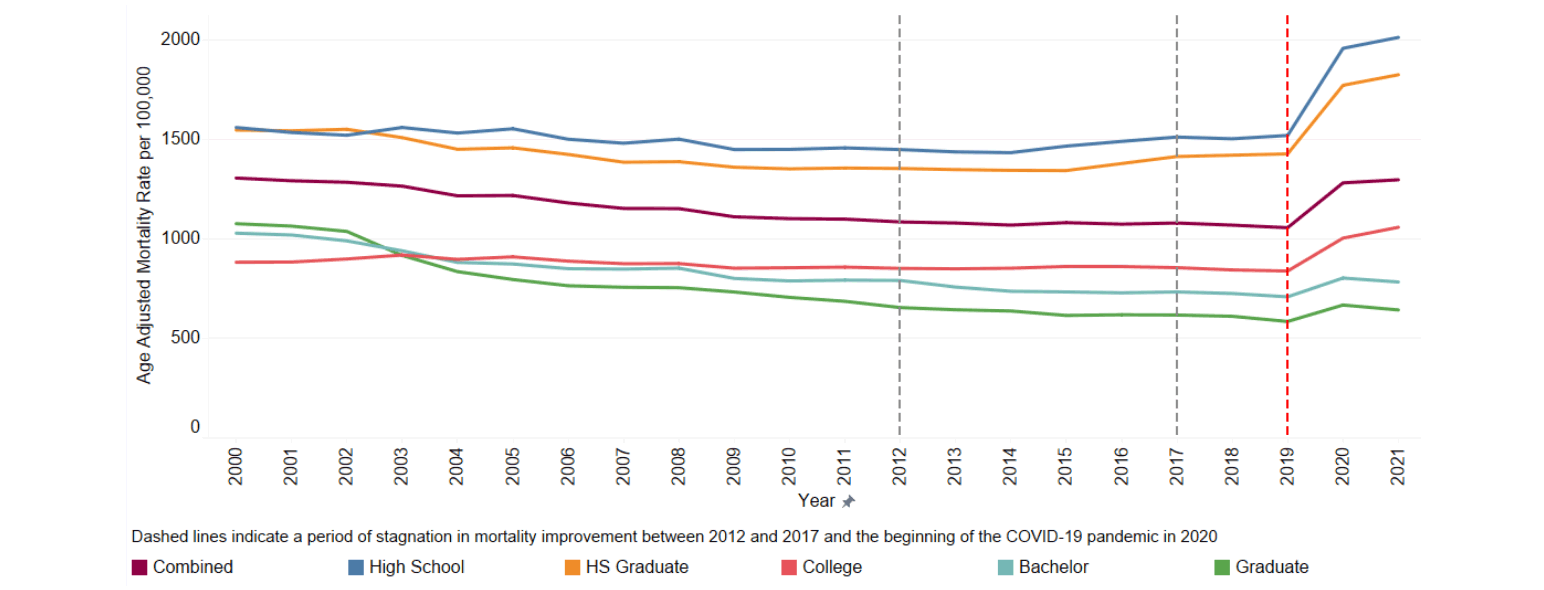
The age adjusted mortality rate continued to increase in 2021 due to the COVID-19 pandemic (Combined line in Figure 1 above) with a 1.2% increase from the 2020 rate and a 22.8% increase from the 2019 rate. This increase resulted in the highest mortality level seen since 2003. This increase was driven by the lower levels of educational attainment: High School (individuals that did not receive a high school diploma), HS Graduate (individuals that received a high school diploma), and College (individuals who attended college but did not receive a bachelor’s degree). The higher education levels (those individuals with bachelor or graduate degrees), saw a decrease in the mortality rate in 2021 compared to 2020. This is a promising sign for insurers as the fully underwritten insured population is generally skewed towards individuals in higher socioeconomic classes, indicating relief from the elevated mortality levels seen during the pandemic may be coming for insurers of these lives. However, life insurance policies issued in lower socioeconomic groups such as lower face simplified issue or final expense are less likely to see this immediate relief as the mortality trend for lower educational groups still saw disimprovement in 2021.
The increase in the overall mortality rate was driven primarily by COVID-19, external causes,[2] and the residual causes.[3] The continued opioid crisis, driven by the increase in overdoses from synthetic opioids such as fentanyl, was a large component of the increases observed in the external causes. However, these large-scale increases occurred primarily in the lower educational attainment groups which are less likely to be a part of the fully underwritten insured population.
US population experience varies significantly by age. In 2020, all ages saw an increase in mortality rates compared to 2019. In 2021, the mortality rates for ages under 80 continued to rise while ages 80+ fell from their 2020 levels. The age group 40–44 experienced the largest increase with a 19.2% increase in the mortality compared to 2020 largely driven by deaths due to COVID-19 and external causes. Ages 85–90, which had the largest increase in 2020, saw the largest decrease in 2021 with a 6.5% decrease. This was largely driven by decreases in deaths due to COVID-19, Alzheimer’s and dementia, cardiovascular, and other respiratory causes. COVID-19 deaths in 2021 were lower due to a high take-up rate in vaccinations for this age group.
Impact of COVID-19
COVID-19 remained the third leading cause of death in 2021, accounting for 12.1% of all deaths (ages 15+), an increase from the 10.5% observed in 2020. Furthermore, 13.1% of all deaths had COVID-19 somewhere on the death certificate (underlying and contributing causes of death). The mortality rate from COVID-19 also increased 18.6% from 2020 to 2021.
Table 1 below displays the distribution of COVID-19 deaths across age bands for 2020 and 2021. A major shift occurred in the prevalence of COVID-19 deaths from the oldest age band to younger age bands. This shift was due to higher vaccination rates at these oldest ages.
Table 1
Distribution of COVID-19 Deaths Across Age Bands by Year

Males represented 56.3% of all COVID-19 deaths compared to 54.4% of COVID-19 deaths in 2020, indicating that males continued to make up a larger share of COVID-19 deaths in 2021 than females.
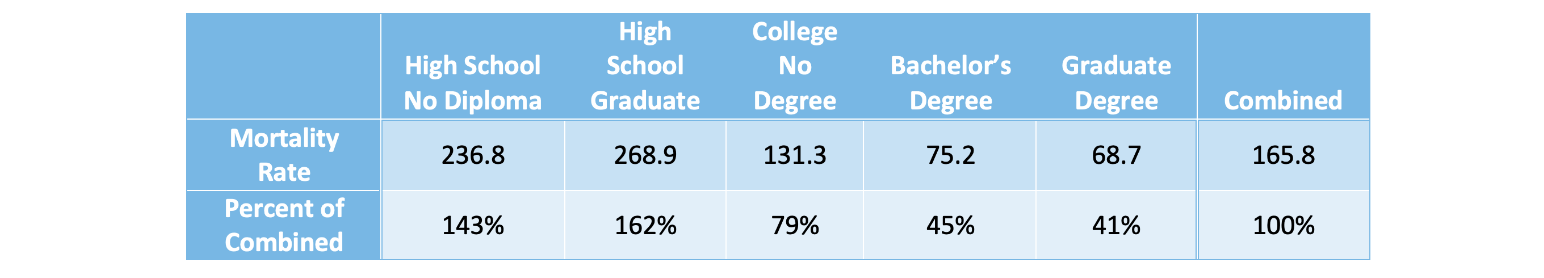
The impact of COVID-19 continued to vary by socioeconomic status for the US population with lower socioeconomic groups, as estimated by educational attainment, experiencing a higher percentage of COVID-19 deaths. The mortality rates reflect this as those without a university degree showed much higher mortality rates from COVID-19 than those who have a bachelor’s or graduate degree (see Table 2 below).
Table 2
COVID-19 Mortality Rates per 100,000 by Educational Attainment (2021)
Change in Trends for Other Causes of Death
The overall US population mortality rate (not age adjusted) for 2021 was 2.0% higher than 2020. When all deaths due to COVID-19 were excluded (including deaths where COVID-19 was listed as a contributing cause), the overall mortality rate for 2021 was 0.1% lower than 2020. However, this level of mortality is still elevated from pre-pandemic levels due to non-COVID-19 excess deaths. Figure 2 below shows the distribution of deaths by cause of death.
Figure 2
Distribution of Deaths Across Age by Cause of Death and Age
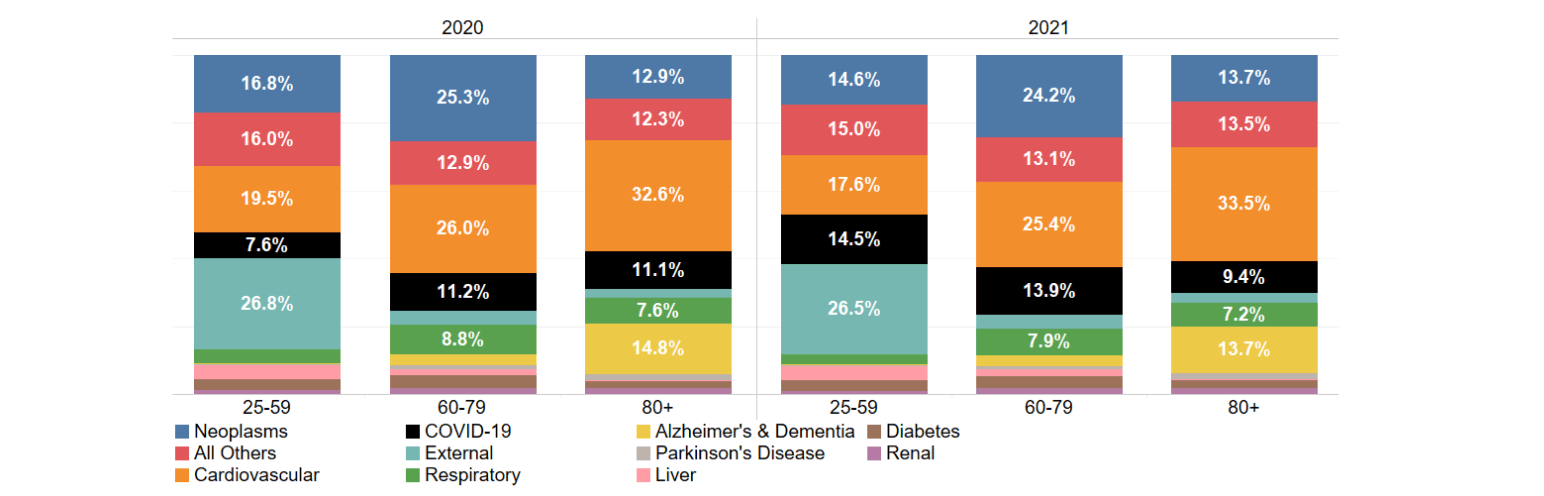
For all ages combined, the top three individual causes of death were cardiovascular disease, neoplasms, and COVID-19. It is worth noting that the individual life insured population has underwriting standards in place that remove some of the risks from cardiovascular disease. The combination of underwriting standards and a higher socioeconomic makeup has historically resulted in the order of the top two causes of death being reversed for the fully underwritten insured population, with neoplasms as the top cause of death and cardiovascular deaths as the second. The age shift in the distribution of COVID-19 deaths discussed in the prior section is evident in Figure 2 where COVID-19 makes up a larger percentage of all deaths for ages 25–59 and 60–79 in 2021 than in 2020, and a smaller percentage for ages 80+.
In 2021, select causes of death saw mortality rates recover from the large increases experienced in 2020 while others continued to show a significant percentage increase. Figure 3 illustrates the annual percentage change in the mortality rate by cause of death for the most recent five years of experience.
Figure 3
Change in US Population Mortality Rate, Qx, (Year Over Year) by Cause of Death
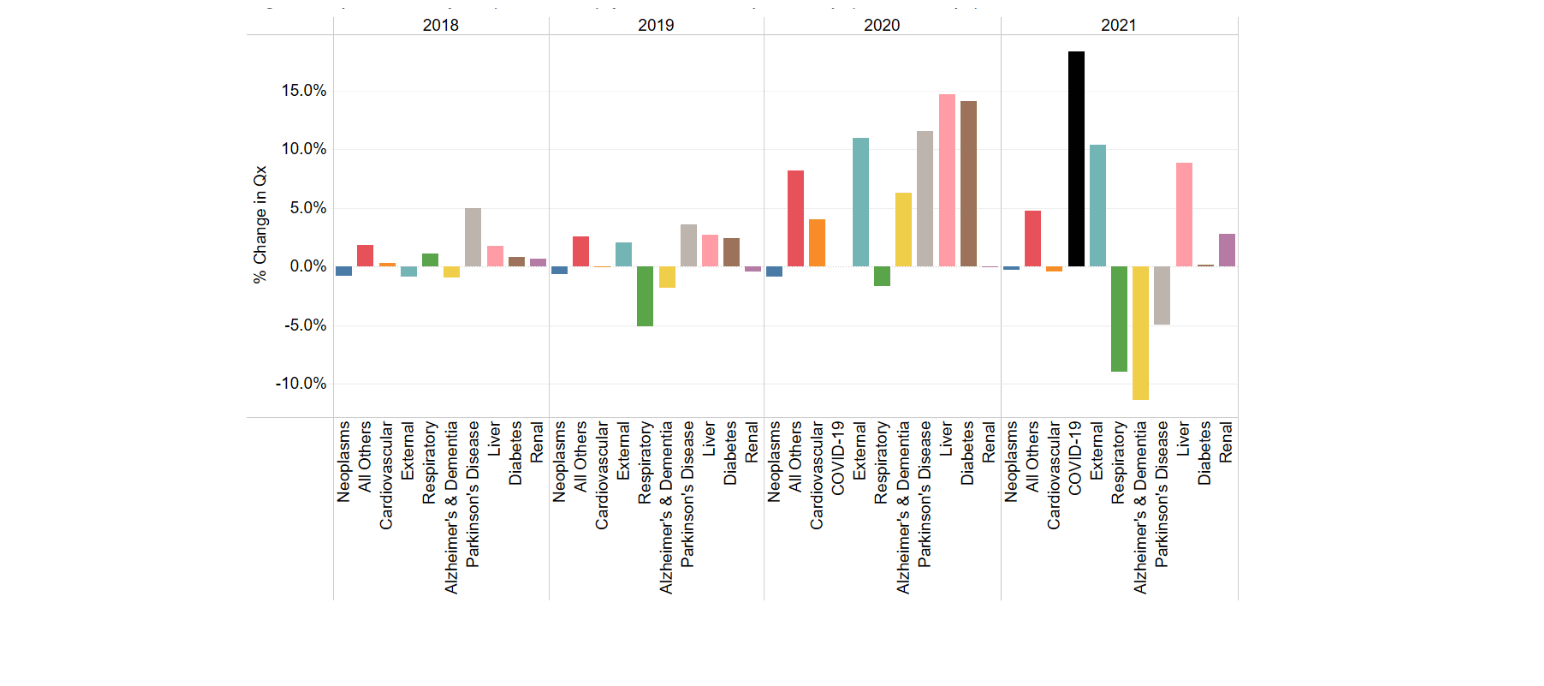
Several of the top ten causes of death saw large increases while others saw large decreases. These offset each other, resulting in the 0.1% decrease observed overall (excluding COVID-19).
- Liver and external mortality rates continued to increase above the increases already observed in 2020. However, these increases were smaller than those observed in 2020.
- Renal mortality also increased, which is the first increase since 2018.
- Respiratory deaths continued to decline, driven by the non-existent 2020/2021 and 2021/2022 flu seasons.
- The Alzheimer’s and dementia mortality rate decreased to the lowest level seen in the five-year period, recovering from the sharp increase observed in 2020.
- Parkinson’s also decreased from the 2020 levels while remaining above 2019 levels resulting in a continuation of the increasing pattern observed in the pre-pandemic years.
The increase in the mortality rate for external deaths is largely driven by the increase in opioid deaths (17.2% increase in 2021), other accidental poisonings (11.9% increase in 2021), and motor vehicle accidents (10.7% increase in 2021). Opioids deaths and accidental poisoning deaths (which includes other drug overdoses) are less significant for the fully underwritten insured population which typically targets middle to higher socioeconomic markets but may be more significant for life insurance targeting lower socioeconomic markets. The mortality rate for suicides, which is a significant external cause of death for the younger ages of the insured population (and all socioeconomic groups), increased by 4.5% in 2021. This returned the suicide mortality rate to pre-pandemic levels after a decrease observed in 2020.
Several causes of death saw only very small changes to their mortality rates in 2021 (when excluding all COVID-19 deaths). These were neoplasms (0.2% decrease), cardiovascular (0.4% decrease) and diabetes (0.2% increase). Two of these, cardiovascular and diabetes, had seen large increases in 2020. The limited change in 2021 indicates the mortality rates for these two causes remain elevated compared to pre-pandemic levels.
Conclusion
US mortality rates for the overall general population continued to rise in 2021. However, significant differences were observed by educational attainment which is used as a proxy for socioeconomic status. The highest levels of educational attainment (bachelor’s and graduate) saw mortality rates start to decline in 2021 while lower levels of educational attainment continued to see significant increases. Differences were also observed by age with ages less than 80 increasing when compared to 2020 and ages 80 and older decreasing. Increases in mortality rates overall were driven by increased deaths from COVID-19, external causes and residual causes.
Given these large differences in mortality trends by educational attainment and age, differences are expected to be observed in the insured population. Furthermore, depending on the level of underwriting and target socioeconomic market, future mortality trends will vary significantly.
Statements of fact and opinions expressed herein are those of the individual authors and are not necessarily those of the Society of Actuaries, the editors, or the respective authors’ employers.
Becca Reppert, FSA, CERA, MAAA, is an experience analysis actuary at SCOR. She can be reached at breppert@scor.com.
Carolyn Covington, FSA, CERA, MAAA, is vice president and actuary at SCOR. She can be reached at ccovington@scor.com.