
Modeling Extreme Events
By Jason Reed
Predictive Analytics and Futurism Section Newsletter, June 2021

The fundamental purpose of insurance is to offer protection from events that would cause extreme financial hardship, such as catastrophic medical bills, death or disability. These events are, by their nature (as insurable risks), aberrations from the “normal” course of life, but we can improve our analysis by distinguishing by degrees how extreme these events are. We can classify losses in the normal course of business as “expected loss,” less frequent and larger but still predictable losses as “unexpected loss,” and improbable but still possible (and frequent enough that they require planning) as “stress loss.”
In the categorization above, health insurance claims could be loosely divided into standard recurring claims (normal flu season, usual number of accidents and doctor’s visits), large but predictable claims (serious illness generally up to $100,000–$250,000 per person, claims that do not affect a large fraction of the population but are frequent enough to model accurately), and catastrophic claims, which are rare and highly variable in magnitude, to which we can apply the statistical tools of extreme value theory. Extreme events drive a significant fraction of risk in a health insurer’s portfolio. Although this latest coronavirus epidemic did not entail catastrophic health risk, it could easily have done so if the strain was more virulent. Other examples of extreme events are widespread floods (for property risk), a stock market crash (for life insurance) or an earthquake causing large numbers of hospitalizations.
The more unusual an event is, the more challenging it is to model since an insurance company has much less experience in that part of the claims distribution. In a health insurance context, dollars above a high threshold per individual are pooled across a block, being too rare to model on a group-by-group basis. Actuaries can borrow from statistical theory to build better estimates of stress loss in the extreme tail of the claims distribution.
In the real world, the tails of the health insurance claim distribution are much fatter than the normal distribution, and different techniques are needed to model claim structure (incidence and severity). Extreme value theory tries to answer questions about the probability of catastrophic claims, their frequency in a given time period, and the magnitude of such claims given they exceed a threshold (e.g., $250,000). Insurers rarely have enough experience data to describe the distribution of the extreme tail well, but extreme value theory can parametrize their asymptotic behavior.
The actuarial approach to pricing and estimating risk naturally focuses on where most of the information is, which clusters around the center of the distribution. The problem is that the pattern that holds in the main part of the claims distribution generally is quite different from the shape of claims in the tail. Actuaries need separate models to describe the behavior of extreme claims so that estimates are not entirely driven by the pattern in the bulk of lower-severity claims. There is a classic variance-bias tradeoff we must make when estimating tail risk. The further we go out into the tail the better we are estimating truly extreme events (low bias), but the less data we have to calculate estimates (high variance). Conversely, if we try to extrapolate from a less extreme part of the distribution we are more likely to mistakenly estimate the tail risk (high bias) but we have more data with which to make inferences (low variance).
There are two main statistical approaches to modeling extreme events:
Block maxima: Divvy the risks into collections of groups or individuals of size m and model the maximum PMPM over the n collections , either over time or within a block if you have sufficiently many groups
Peak over threshold: Fix a threshold PMPM u and study the residuals in excess of for groups or individuals that exceed that threshold (the exceedance given that the random variable is greater than ).
Both approaches have advantages and drawbacks. The block maximum approach can be tailored to different block sizes and does not require additional parameters, but it requires we throw away information, since we are only studying the most extreme value in each block. Conversely, the peak over threshold preserves more information but requires that we set an arbitrary cutoff value . Interestingly, there is a theoretical connection between the limiting distribution of both approaches.
The critical statistical distribution to understand when modeling extreme events is the Pareto distribution, which is well-suited to modeling distributions with fat tails. Its properties were first explored by the Italian economist Vilfredo Pareto (1848–1923). The defining characteristic that makes it useful for the study of extreme values is that its cumulative distribution function decays at a polynomial rate, which is much slower than the exponential decay of the normal distribution. There are statistical theorems that show that under certain conditions, both the block maxima and the peak over threshold sequences converge to a generalized Pareto distribution. This happens independently of the distribution of the underlying claim random variables provided they are independent and identically distributed. For example, even if the underlying group loss distribution followed a Cauchy distribution, the sequence of block maxima or peaks over threshold can be modeled using the Pareto. This is a powerful result since over the threshold we would not need to model the entire distribution but rather only estimate the three parameters of the generalized Pareto distribution ξ, μ, and σ, which is a tremendous advantage since we rarely have enough data to model the entire distribution beyond that extreme value.
Statistical theory allows us to estimate extreme claims over a threshold given that this threshold is exceeded, but it leaves a gap regarding the probability that this threshold is exceeded. That is, while it provides an answer to the conditional severity distribution, it is silent about the incidence of such extreme events. For pricing we need both components. A natural approach to estimating the probability of an event would be a logistic regression model, which would give probabilities that an individual or group’s claims exceed the threshold conditional on age, gender, and health status. That is, for each demographic and health profile we would calculate a probability that the individual would experience claims above the threshold. The problem is that the usual estimators of logistic regression models in SAS or R (using maximum likelihood estimation) are biased for rare events. Unfortunately, this bias is such that they underestimate the probability of realizing an extreme event, so if we use such estimators directly, we run the risk of underpricing. Fortunately, there are correction factors that can be derived, leading to slightly biased estimators (only the maximum likelihood estimators are unbiased), yet having significantly smaller variance and mean squared error.
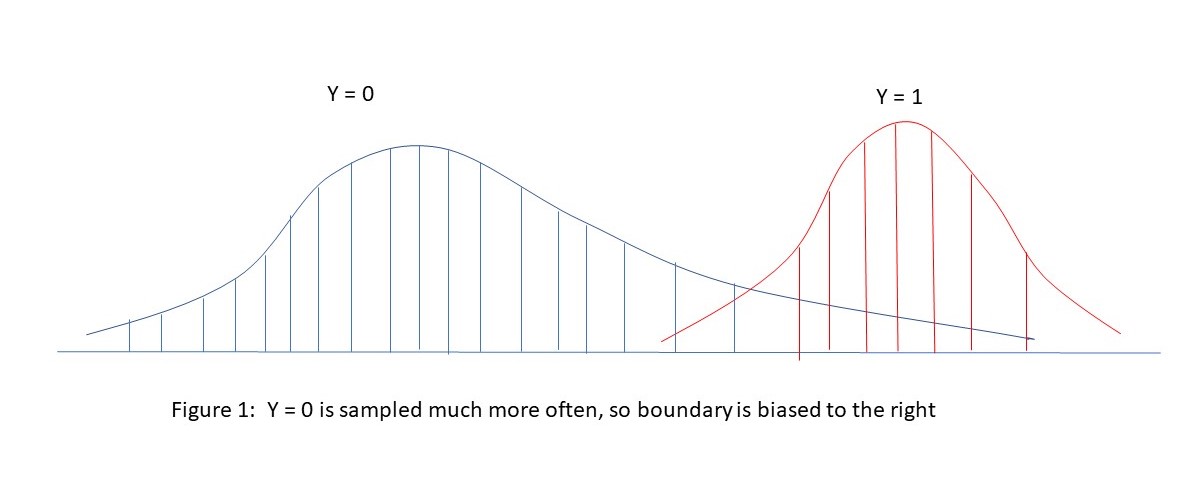
As a heuristic way to see why our usual estimates of extreme value incidence are biased, consider the picture below showing the distribution of non-extreme (Y=0) and extreme (Y=1) events. With naïve sampling, we are less likely to see representative data in the tails of the extreme event distribution relative to the (much more prevalent) non-extreme event distribution. This will lead to the estimate of the cut-point between Y=0 and Y=1 tending to be too far to the right, meaning an underestimate of the incidence of extreme events (Y=1). See the illustration in Figure 1 below, showing how the boundary between Y=0 and Y=1 is difficult to accurately estimate without a correction factor.
Figure 1
A Naïve approach Mis-estimates the Boundary between Non-Extreme and Extreme Events
Catastrophic claims drive a significant fraction of the risk in a wide variety of insurance applications. The statistically rich tools of extreme value theory can help actuaries to better understand both the incidence and severity of extreme events. Understanding the asymptotic properties of extreme events can yield a better understanding and management of risk.
Statements of fact and opinions expressed herein are those of the individual authors and are not necessarily those of the Society of Actuaries, the editors, or the respective authors’ employers.
Jason Reed, FSA, is a senior director of Advanced Analytics for Optum. He can be contacted at r.jason.reed@optum.com. https://www.linkedin.com/in/robert-jason-reed-fsa-ms-maaa-08021414/